 Pyrifera
- The draft targets income earned where the buyer has least choice. The widest gaps between today's payouts and the proposed ceilings are in loan-linked life cover, new health policies and third-party motor.
- For a distributor, a commission cap is a cap on customer value. In an illustrative example, a customer who yields ₹1,500 of profit today loses ₹1,000 in year one under the cap, and must renew twice to break even.
- The market sorted companies by who owns the customer. From the 23 September close to 1 October, PB Fintech fell 48 per cent and Turtlemint 49 per cent; lenders and life groups fell 5 to 11 per cent; the agency-led insurer Star Health fell about 2 per cent.
- Bank exposure is concentrated and, on the numbers, manageable. A 30 per cent fall in insurance income would cost even the most exposed banks under 5 per cent of pre-provision profit, before any offsetting action.
- History suggests rerouting, not disappearance, of demand. After the 2010 unit-linked reset, private-sector premiums took seven years to reach a new high. This time the burden falls on the intermediary rather than the policyholder.
- 01What the draft proposes
- 02Why a cap on commission is a cap on customer value
- 03The market's verdict: three tiers of damage
- 04Banks and lenders: the quieter exposure
- 05What history says: the 2010 reset
- 06A working map: four layers, three variables
- 07Five uses of the map
- 08Scenarios and what to watch
- 09Bottom line
- ·Sources, method and terms
01What the draft proposes
On 23 September 2026 the Insurance Regulatory and Development Authority of India (IRDAI) released a consultation paper titled Recalibrating Economics of Insurance Distribution. Press accounts of the paper describe four moves.
- Commission ceilings set by product and by sales channel.
- Persistency-linked life commissions, tied to how long the premium-paying term runs, so that payouts reward customers who stay rather than the first-year sale.
- Tighter expense-of-management (EoM) limits, which cap the overall amount an insurer may spend on acquiring and servicing business.
- Conduct rules. Insurance may not be made a compulsory condition of a loan, and a seller may not demand a customer's phone number before showing a price.
Comments are open until 25 October. Reports add that the heaviest expense limits would phase in over about five years. Two consequences follow: the final rules may differ from the draft, and the effect on reported profits will arrive later than the effect on share prices.
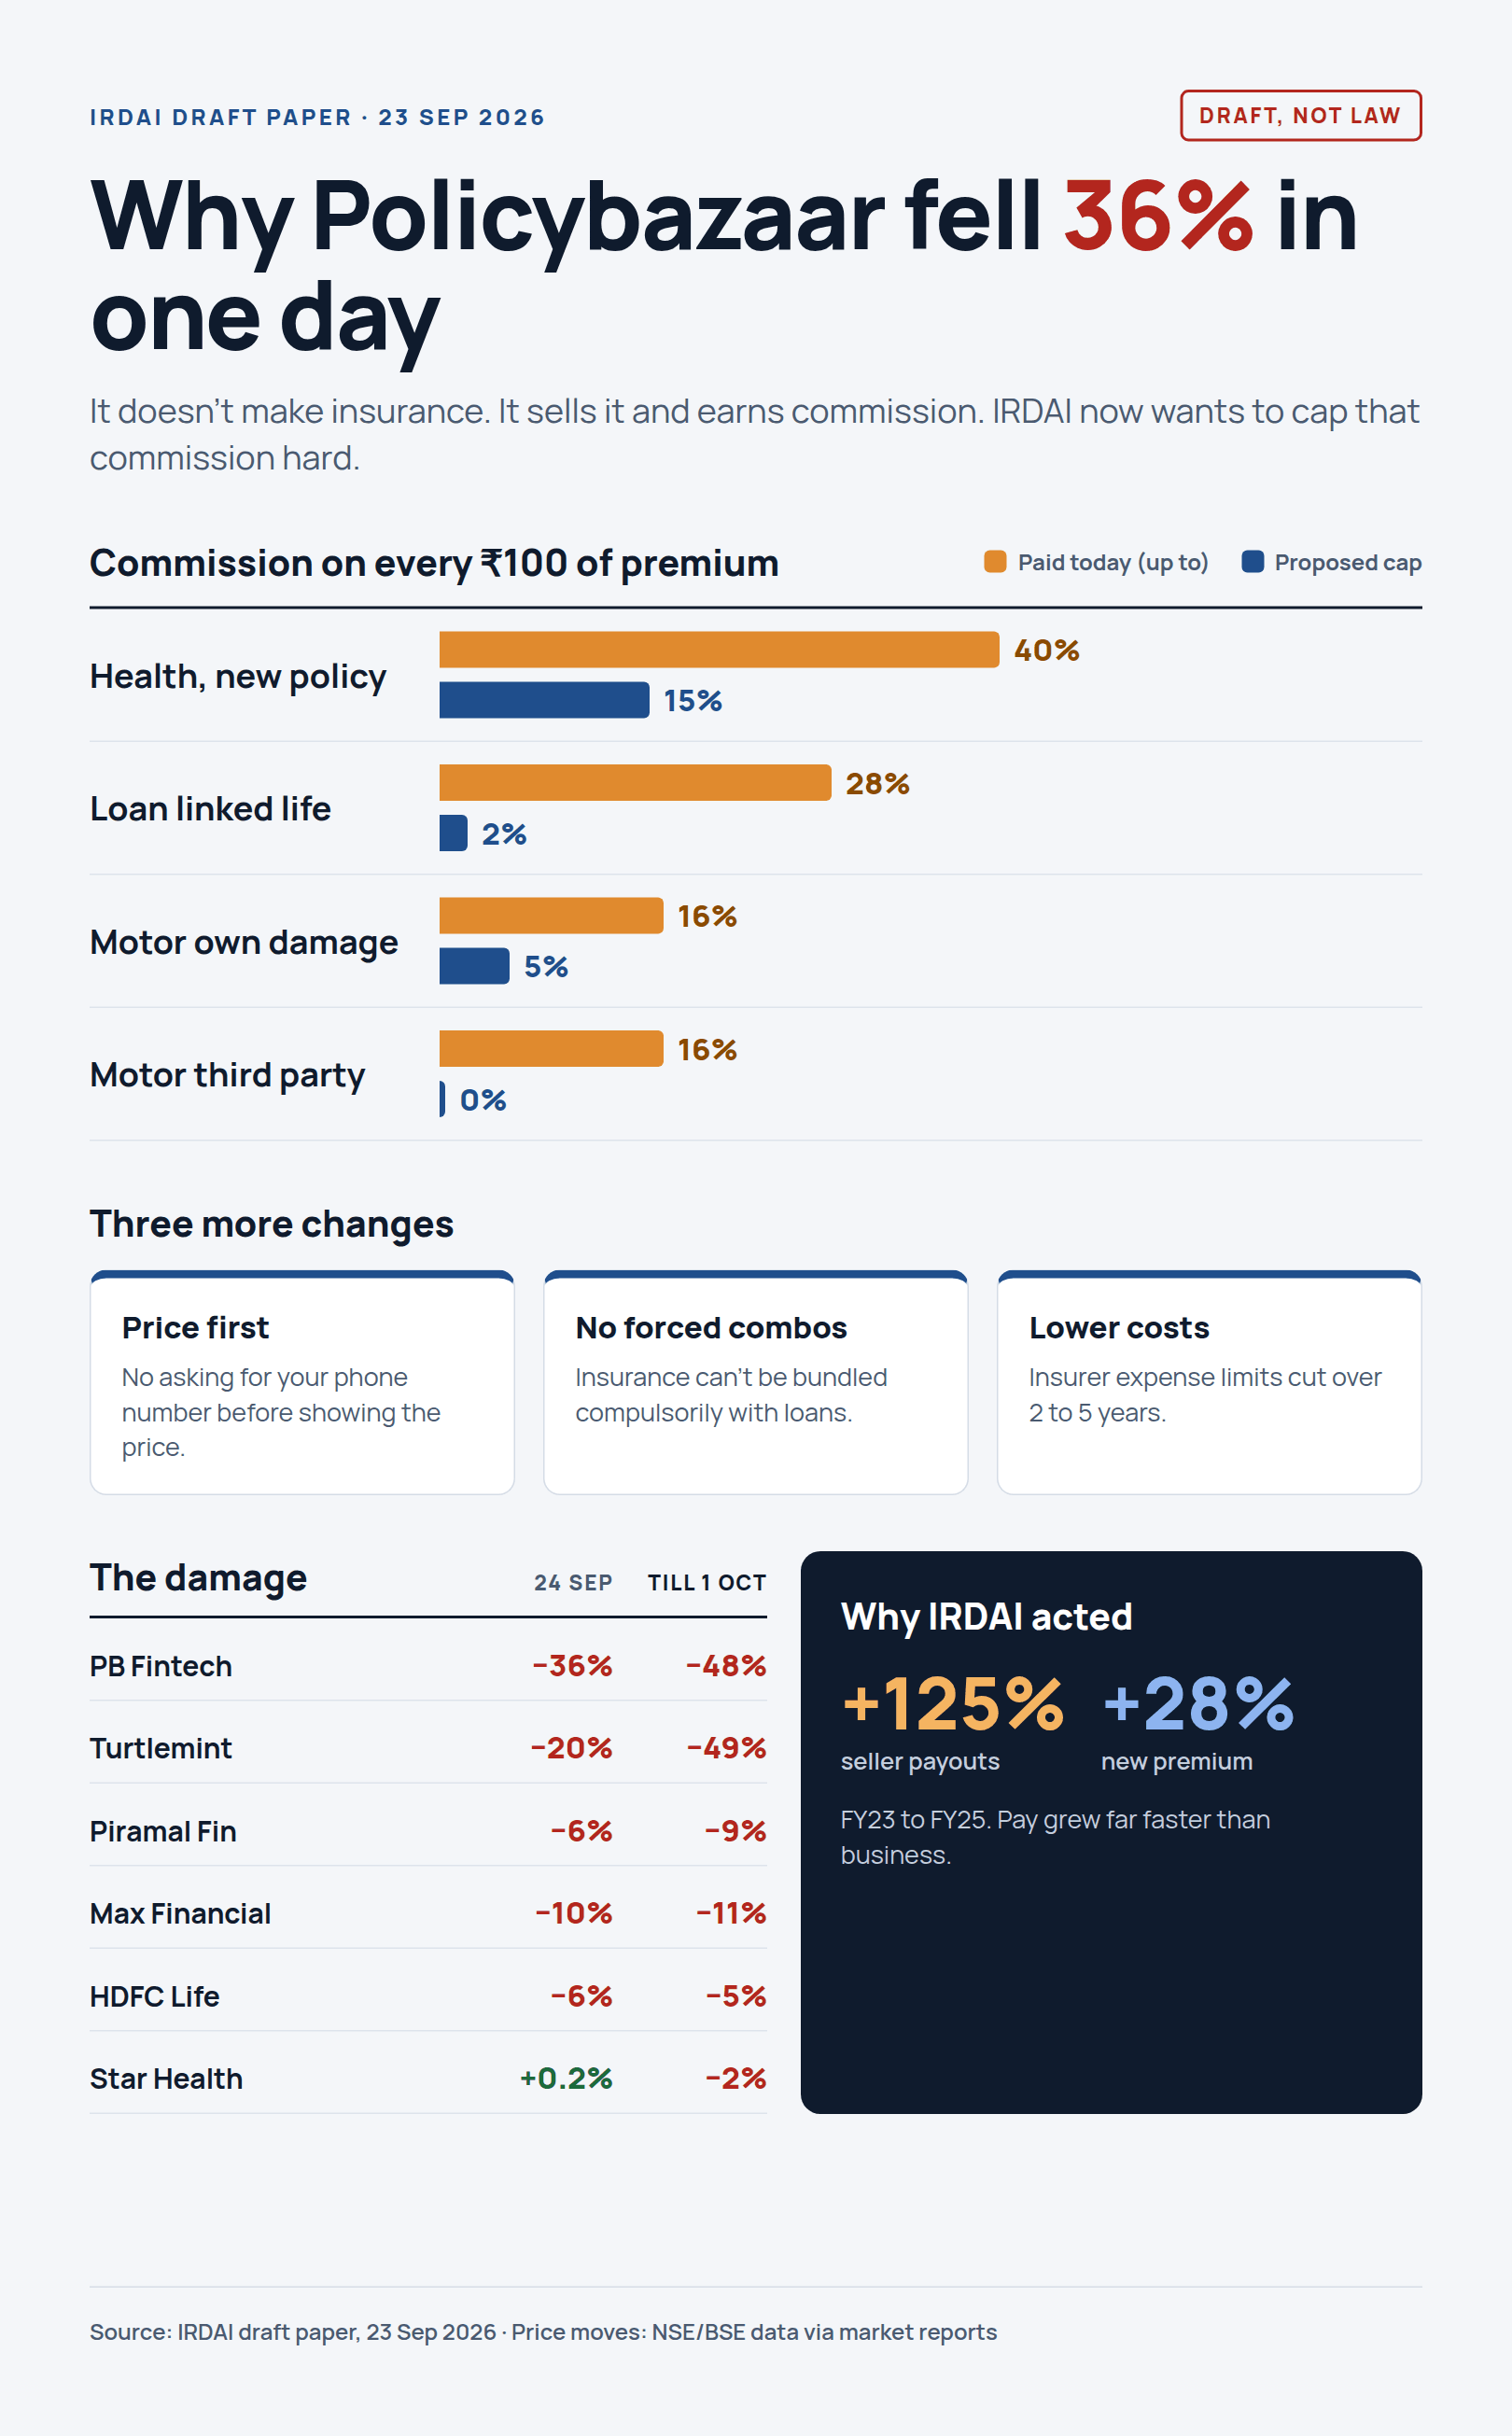
Where the proposed caps are widest
| Product | Today (up to) | Proposed cap | Gap (points) |
|---|---|---|---|
| Loan-linked life | 28 | 2 | −26 |
| Health, new policy | 40 | 15 | −25 |
| Motor third party | 16 | 0 | −16 |
| Motor own damage | 16 | 5 | −11 |
The pattern is informative. The widest gaps sit in products where the buyer has least room to refuse: cover sold at the moment of borrowing, and third-party motor cover that the law already requires. Our reading, which is an inference and not a regulatory statement, is that the draft is aimed less at insurance itself than at income earned from a captive moment of sale rather than from persuasion.
02Why a cap on commission is a cap on customer value
A distributor does not live on the commission rate. It lives on what remains after it has paid to find and serve the customer. The distinction matters because a cap changes the break-even point for acquiring a customer, not merely the size of the cheque.
Consider a health policy with a ₹10,000 annual premium, and assume for illustration that it costs ₹2,500 to acquire and onboard the customer. Table 2 sets out the arithmetic at today's maximum first-year payout and at the proposed cap.
| Item | Today (up to) | Under the cap |
|---|---|---|
| First-year payout | ₹4,000 | ₹1,500 |
| Acquisition cost (assumed) | ₹2,500 | ₹2,500 |
| First-year margin | +₹1,500 | −₹1,000 |
| Renewal payout, per year | not needed | ₹500 |
| Renewals needed to break even | 0 | 2 |
Servicing costs on renewals are ignored, which flatters the cap case.
Under the cap the first year loses money and the customer must renew twice merely to repay the acquisition cost. A distributor facing those economics will rationally pursue fewer customers, and more selectively. The renewal rate, not the sales rate, becomes the number that decides profitability.
There is early evidence of this repricing. Value Research reports that Policybazaar's chief executive has said the company might have hired about 2,000 people in the first half of FY27 had the draft been known, against roughly 6,000 actually hired. No layoffs have been announced. The point is narrower: customers who cleared the old hurdle may not clear the new one.
The same logic explains the scale of the share-price fall. Before the draft the market was paying about 130 times FY26 profit for PB Fintech, roughly ₹87,000 crore against ₹670 crore of profit. The premium rested on renewals, which Value Research puts at margins near 80 per cent and which were expected to compound into recurring earnings. A 5 per cent health-renewal ceiling attacks that annuity directly. Value Research's stress tests put FY28 earnings 30 to 46 per cent lower, depending on how far costs can be cut. A market value near ₹50,000 crore would still equal 50 times profit if sustainable profit settled at ₹1,000 crore. Cheaper after the fall is therefore not the same as cheap.
If retention becomes the business, the metrics that matter move from premium sold to premium kept: renewal rate, cost to serve, and the quality of claims assistance. A distributor that trims the service that earns loyalty in order to protect FY28 may damage FY30.
03The market's verdict: three tiers of damage
Table 3 groups six listed companies across the chain by how much of their revenue is commission and by who controls the sales channel. Moves are measured from the 23 September close.
| Tier | Company | 24 Sep close | To 1 Oct |
|---|---|---|---|
| Distributors | PB Fintech | −36% | −48% |
| Turtlemint | −20% | −49% | |
| Lenders and life groups | Max Financial | −10% | −11% |
| Piramal Finance | −6% | −9% | |
| HDFC Life | −6% | −5% | |
| Agency-led health | Star Health | +0.2% | −2% |
The ordering follows exposure. The two distributors, whose revenue is commission, lost close to half their value. The lenders and life groups, where commission is one line among many, lost 5 to 11 per cent. Star Health, which Jefferies had flagged as relatively insulated because roughly 85 per cent of its business arrives through its own agents, lost about 2 per cent.
The distributors also kept falling after the first day. PB Fintech closed at ₹1,207 on 24 September and at about ₹984 on 1 October, a further decline of roughly 18 per cent, while most insurers steadied. Our reading is that the first day priced the headline and later sessions priced the earnings arithmetic, as brokers cut targets and exchanges added surveillance. That sequence is an observation about timing, not proof of cause.
04Banks and lenders: the quieter exposure
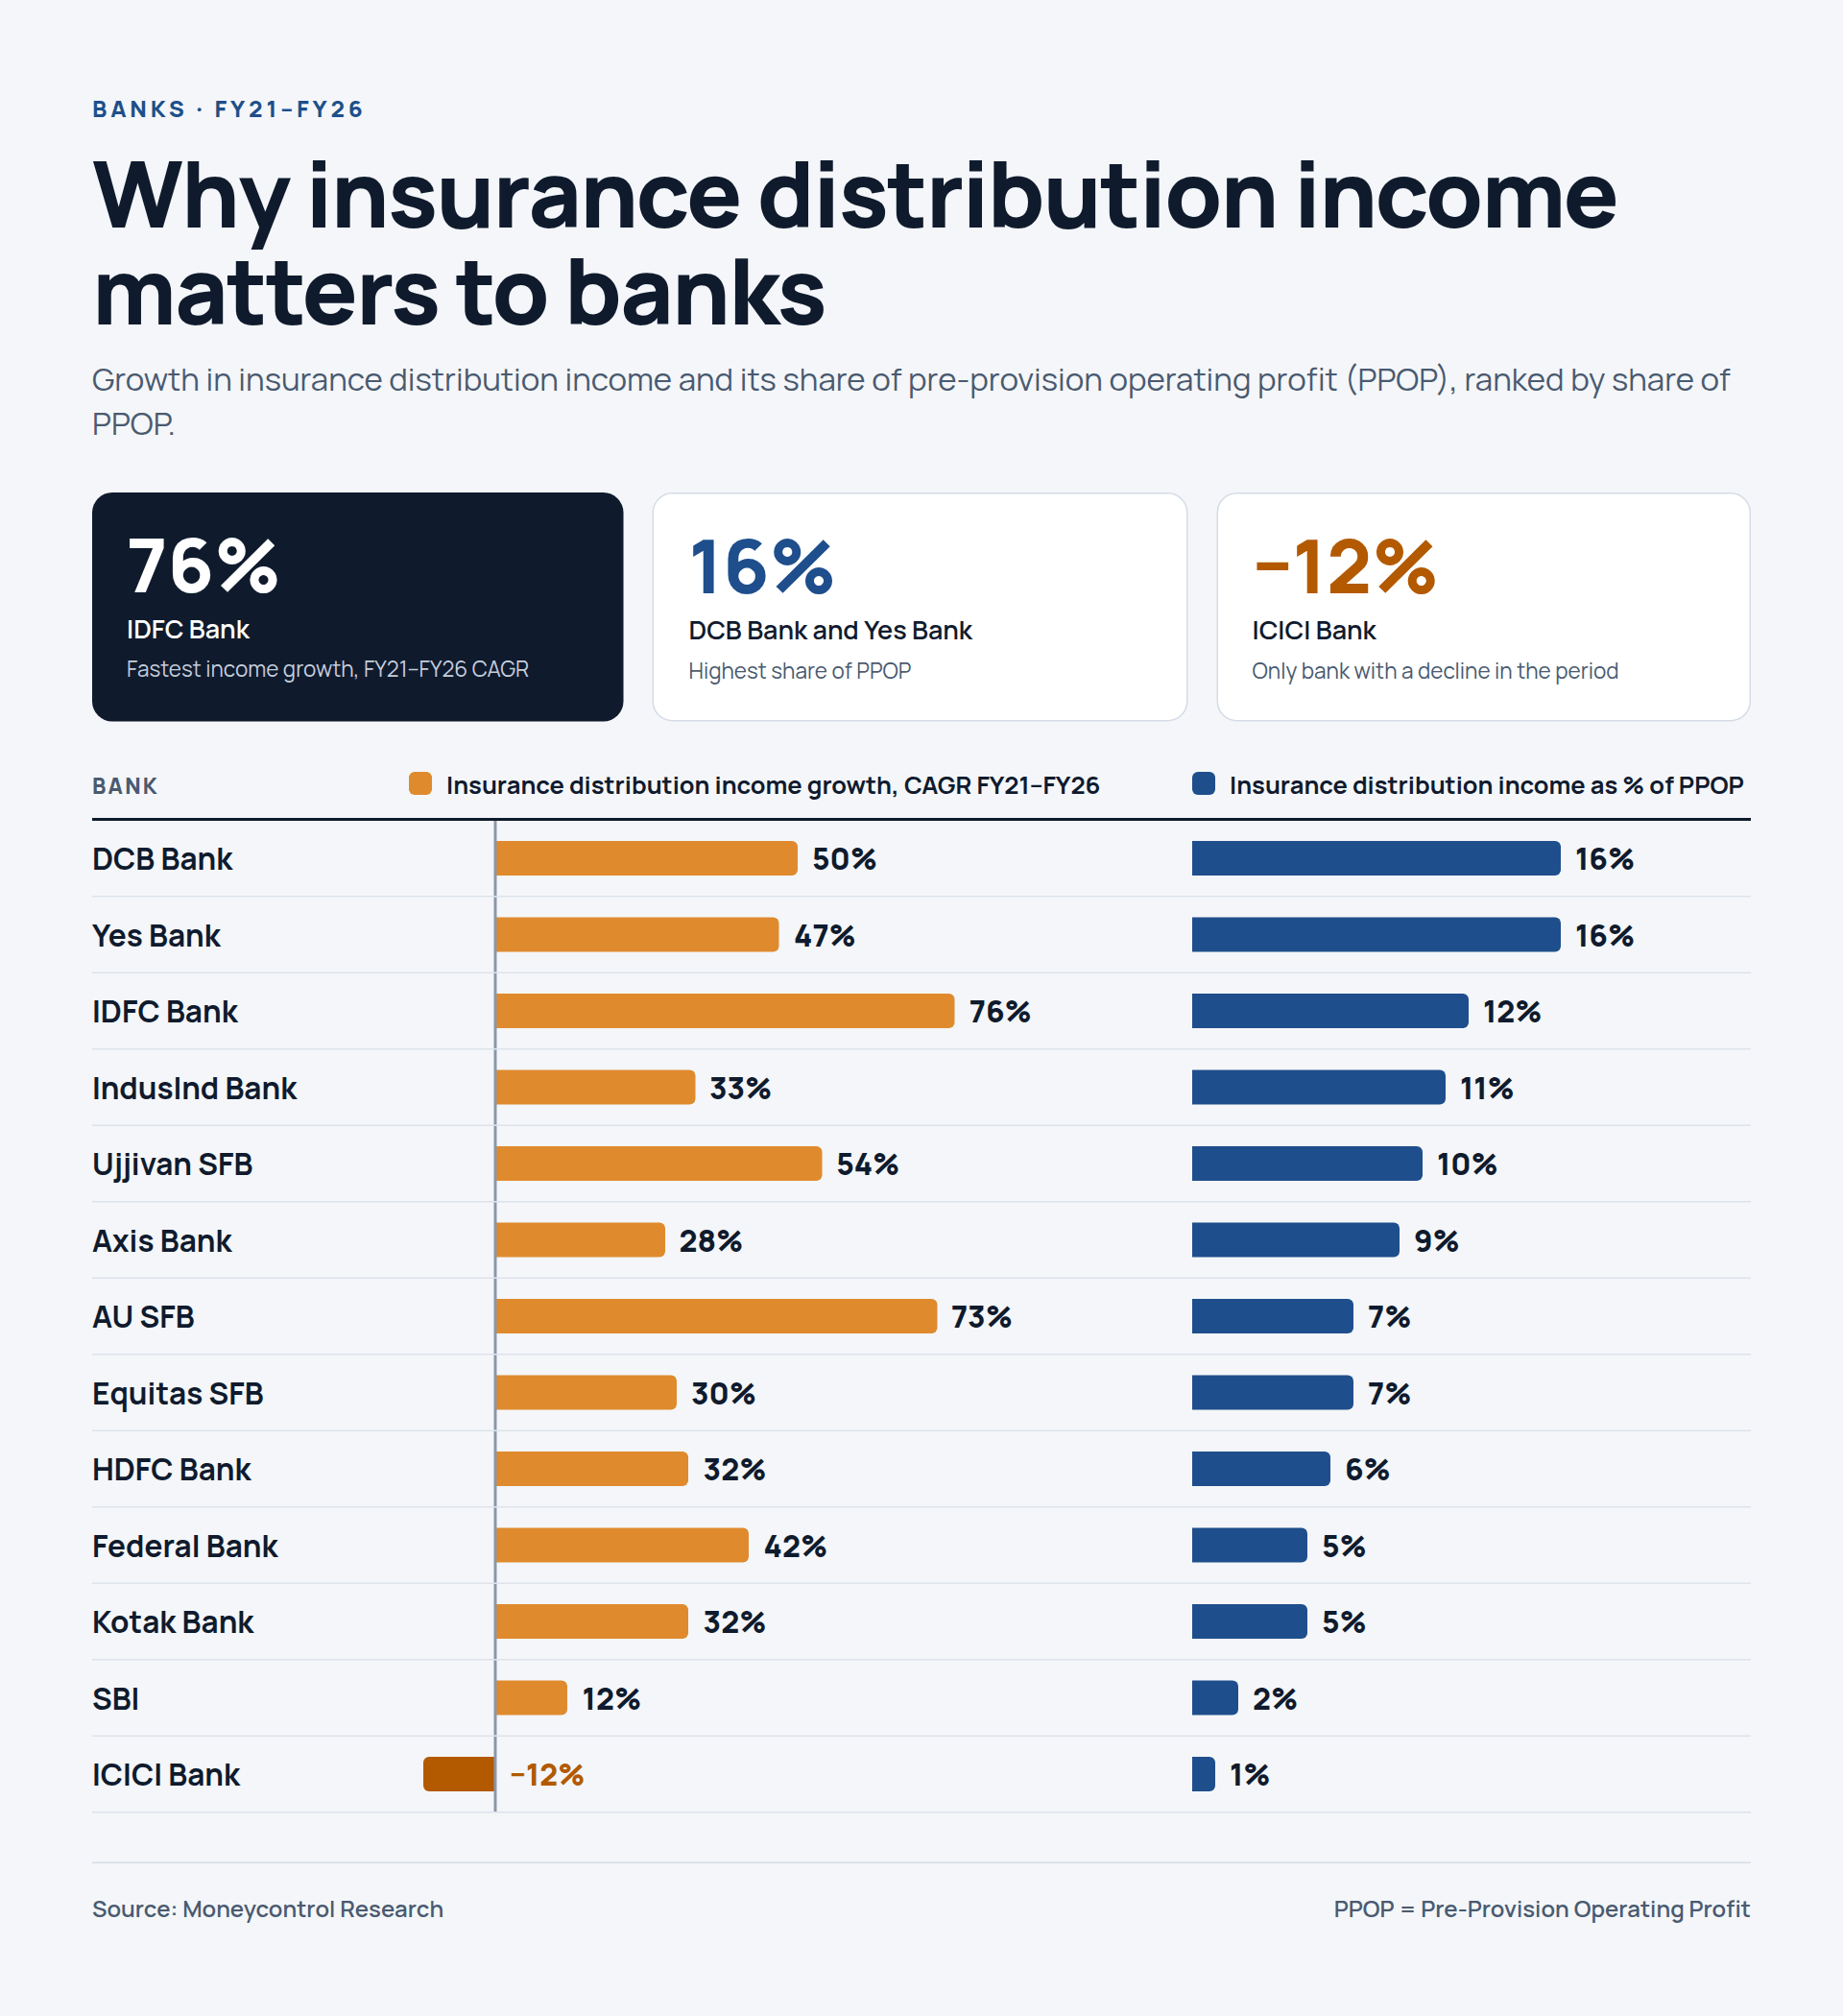
Distributors are the visible casualty. The larger rupee exposure sits inside banks, which earn insurance fees as a by-product of owning the customer relationship. Two public datasets allow a ranking. JM Financial measures insurance income against FY26 profit before tax (PBT). Moneycontrol Research measures it against pre-provision operating profit (PPOP) and adds growth from FY21 to FY26. The two agree on the broad ordering and disagree in instructive ways.
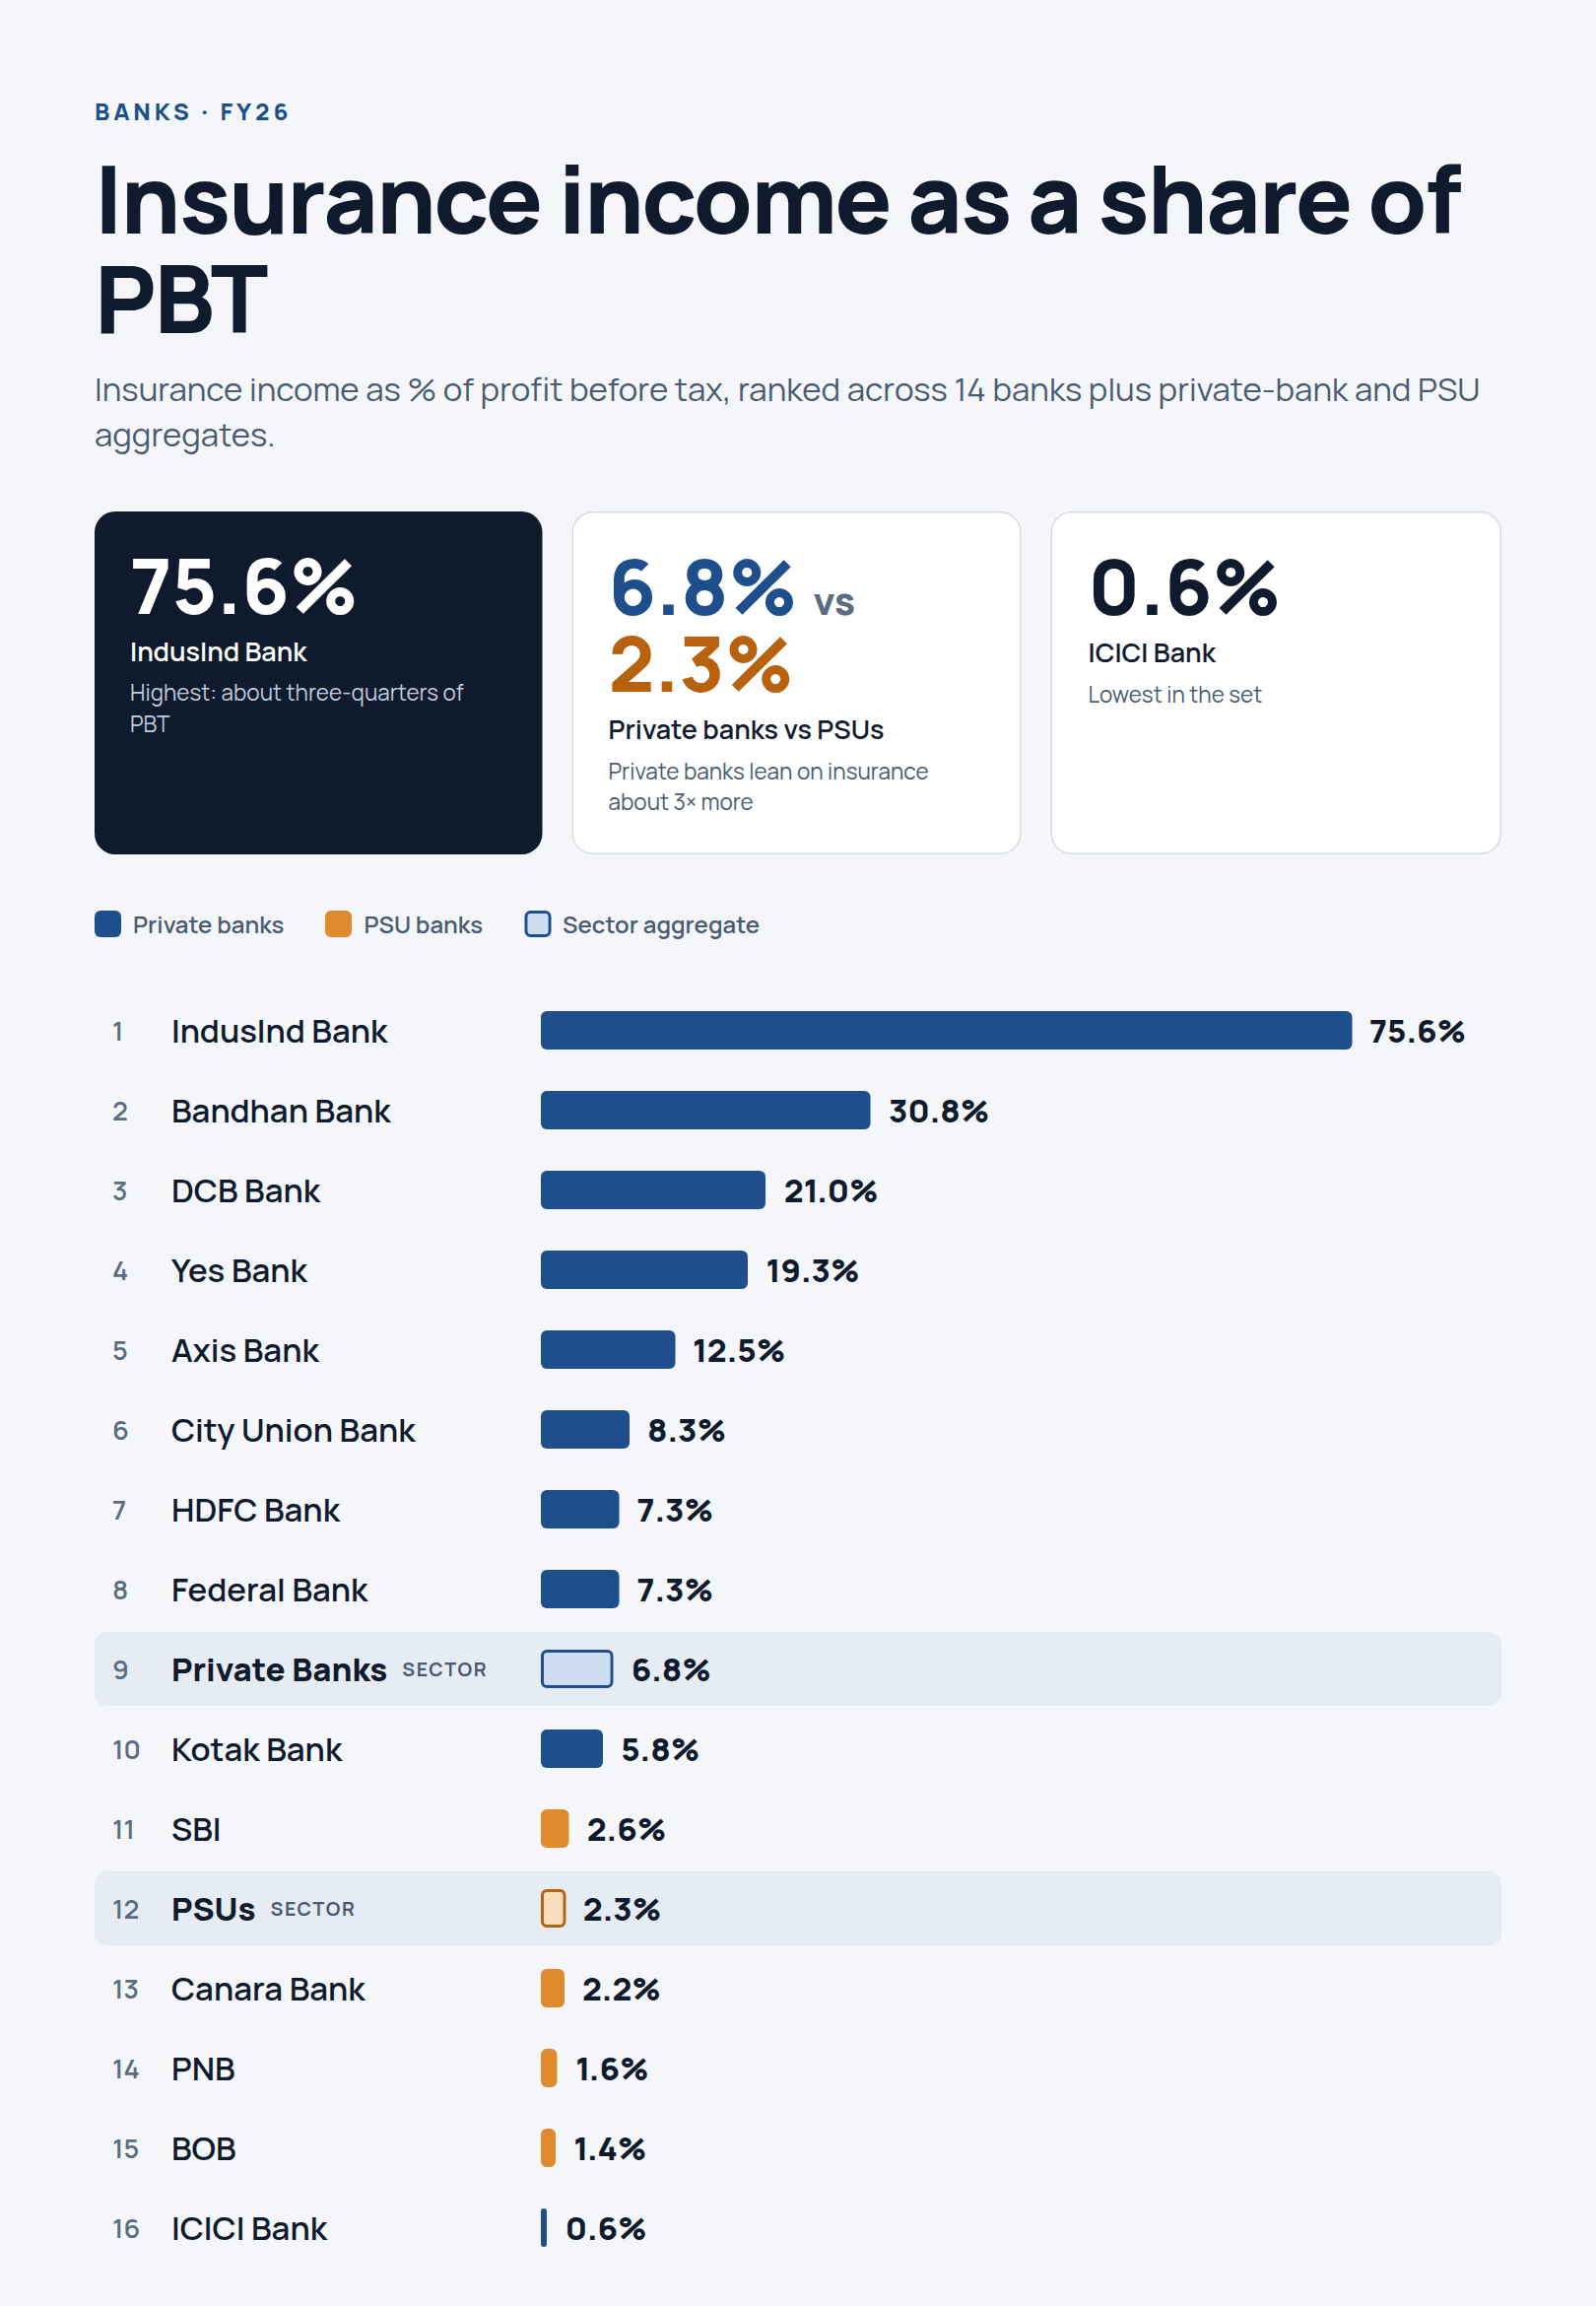
Dependence is concentrated, not general
In the JM Financial set, IndusInd Bank (75.6 per cent of PBT), Bandhan Bank (30.8), DCB Bank (21.0), Yes Bank (19.3) and Axis Bank (12.5) stand apart. Private banks as a group sit at 6.8 per cent, public-sector banks at 2.3 per cent, and ICICI Bank at 0.6 per cent.
Growth is concentrated where the draft bites
Between FY21 and FY26, insurance distribution income compounded at about 76 per cent a year at IDFC First, 73 per cent at AU Small Finance Bank, 54 per cent at Ujjivan and 50 per cent at DCB. A fee line that grows that fast has usually been built quickly, and the quickest ways to build one are bundling with loans and front-loaded commissions, the two practices the draft squeezes hardest. This is again inference: the data show growth, not the method behind it.
The denominator changes the story
IndusInd's insurance income is 75.6 per cent of PBT but 11 per cent of PPOP. If both figures describe the same income, provisions have consumed most of operating profit, so the PBT share says more about a thin profit base than about reliance on insurance. For a regulatory stress, PPOP is the steadier yardstick. The two sources also differ in publisher and, in places, in definition: ICICI Bank is 0.6 per cent of PBT in one and 1 per cent of PPOP in the other, which cannot both describe one pair of numbers. Use them to rank, not to calculate.
| Bank | Insurance, % of PPOP | Hit to PPOP at −30% |
|---|---|---|
| DCB Bank | 16% | −4.8% |
| Yes Bank | 16% | −4.8% |
| IDFC Bank | 12% | −3.6% |
| IndusInd Bank | 11% | −3.3% |
| Ujjivan SFB | 10% | −3.0% |
| Axis Bank | 9% | −2.7% |
| AU SFB | 7% | −2.1% |
| Equitas SFB | 7% | −2.1% |
| HDFC Bank | 6% | −1.8% |
| Federal Bank | 5% | −1.5% |
| Kotak Bank | 5% | −1.5% |
| SBI | 2% | −0.6% |
| ICICI Bank | 1% | −0.3% |
Even at the top of the table the gross hit is under 5 per cent of operating profit. For banks this is an earnings-quality question rather than a solvency one. The sharper effect is on the growth narrative of smaller lenders, which may have been valued partly on fee income.
05What history says: the 2010 reset
India has run a version of this experiment. In 2010, rules on unit-linked plans introduced longer lock-ins and reduced distributor remuneration. In the sector chart in Figure 4, private-sector annual premium equivalent (APE) falls from ₹348 billion in FY10 to ₹166 billion in FY14, a drop of 52 per cent in four years. It regains its FY10 level only in FY17 (₹349 billion), then roughly triples to ₹1,038 billion in FY25. The source's annotations credit the later climb to bancassurance, digital channels and a protection-awareness push after the pandemic.
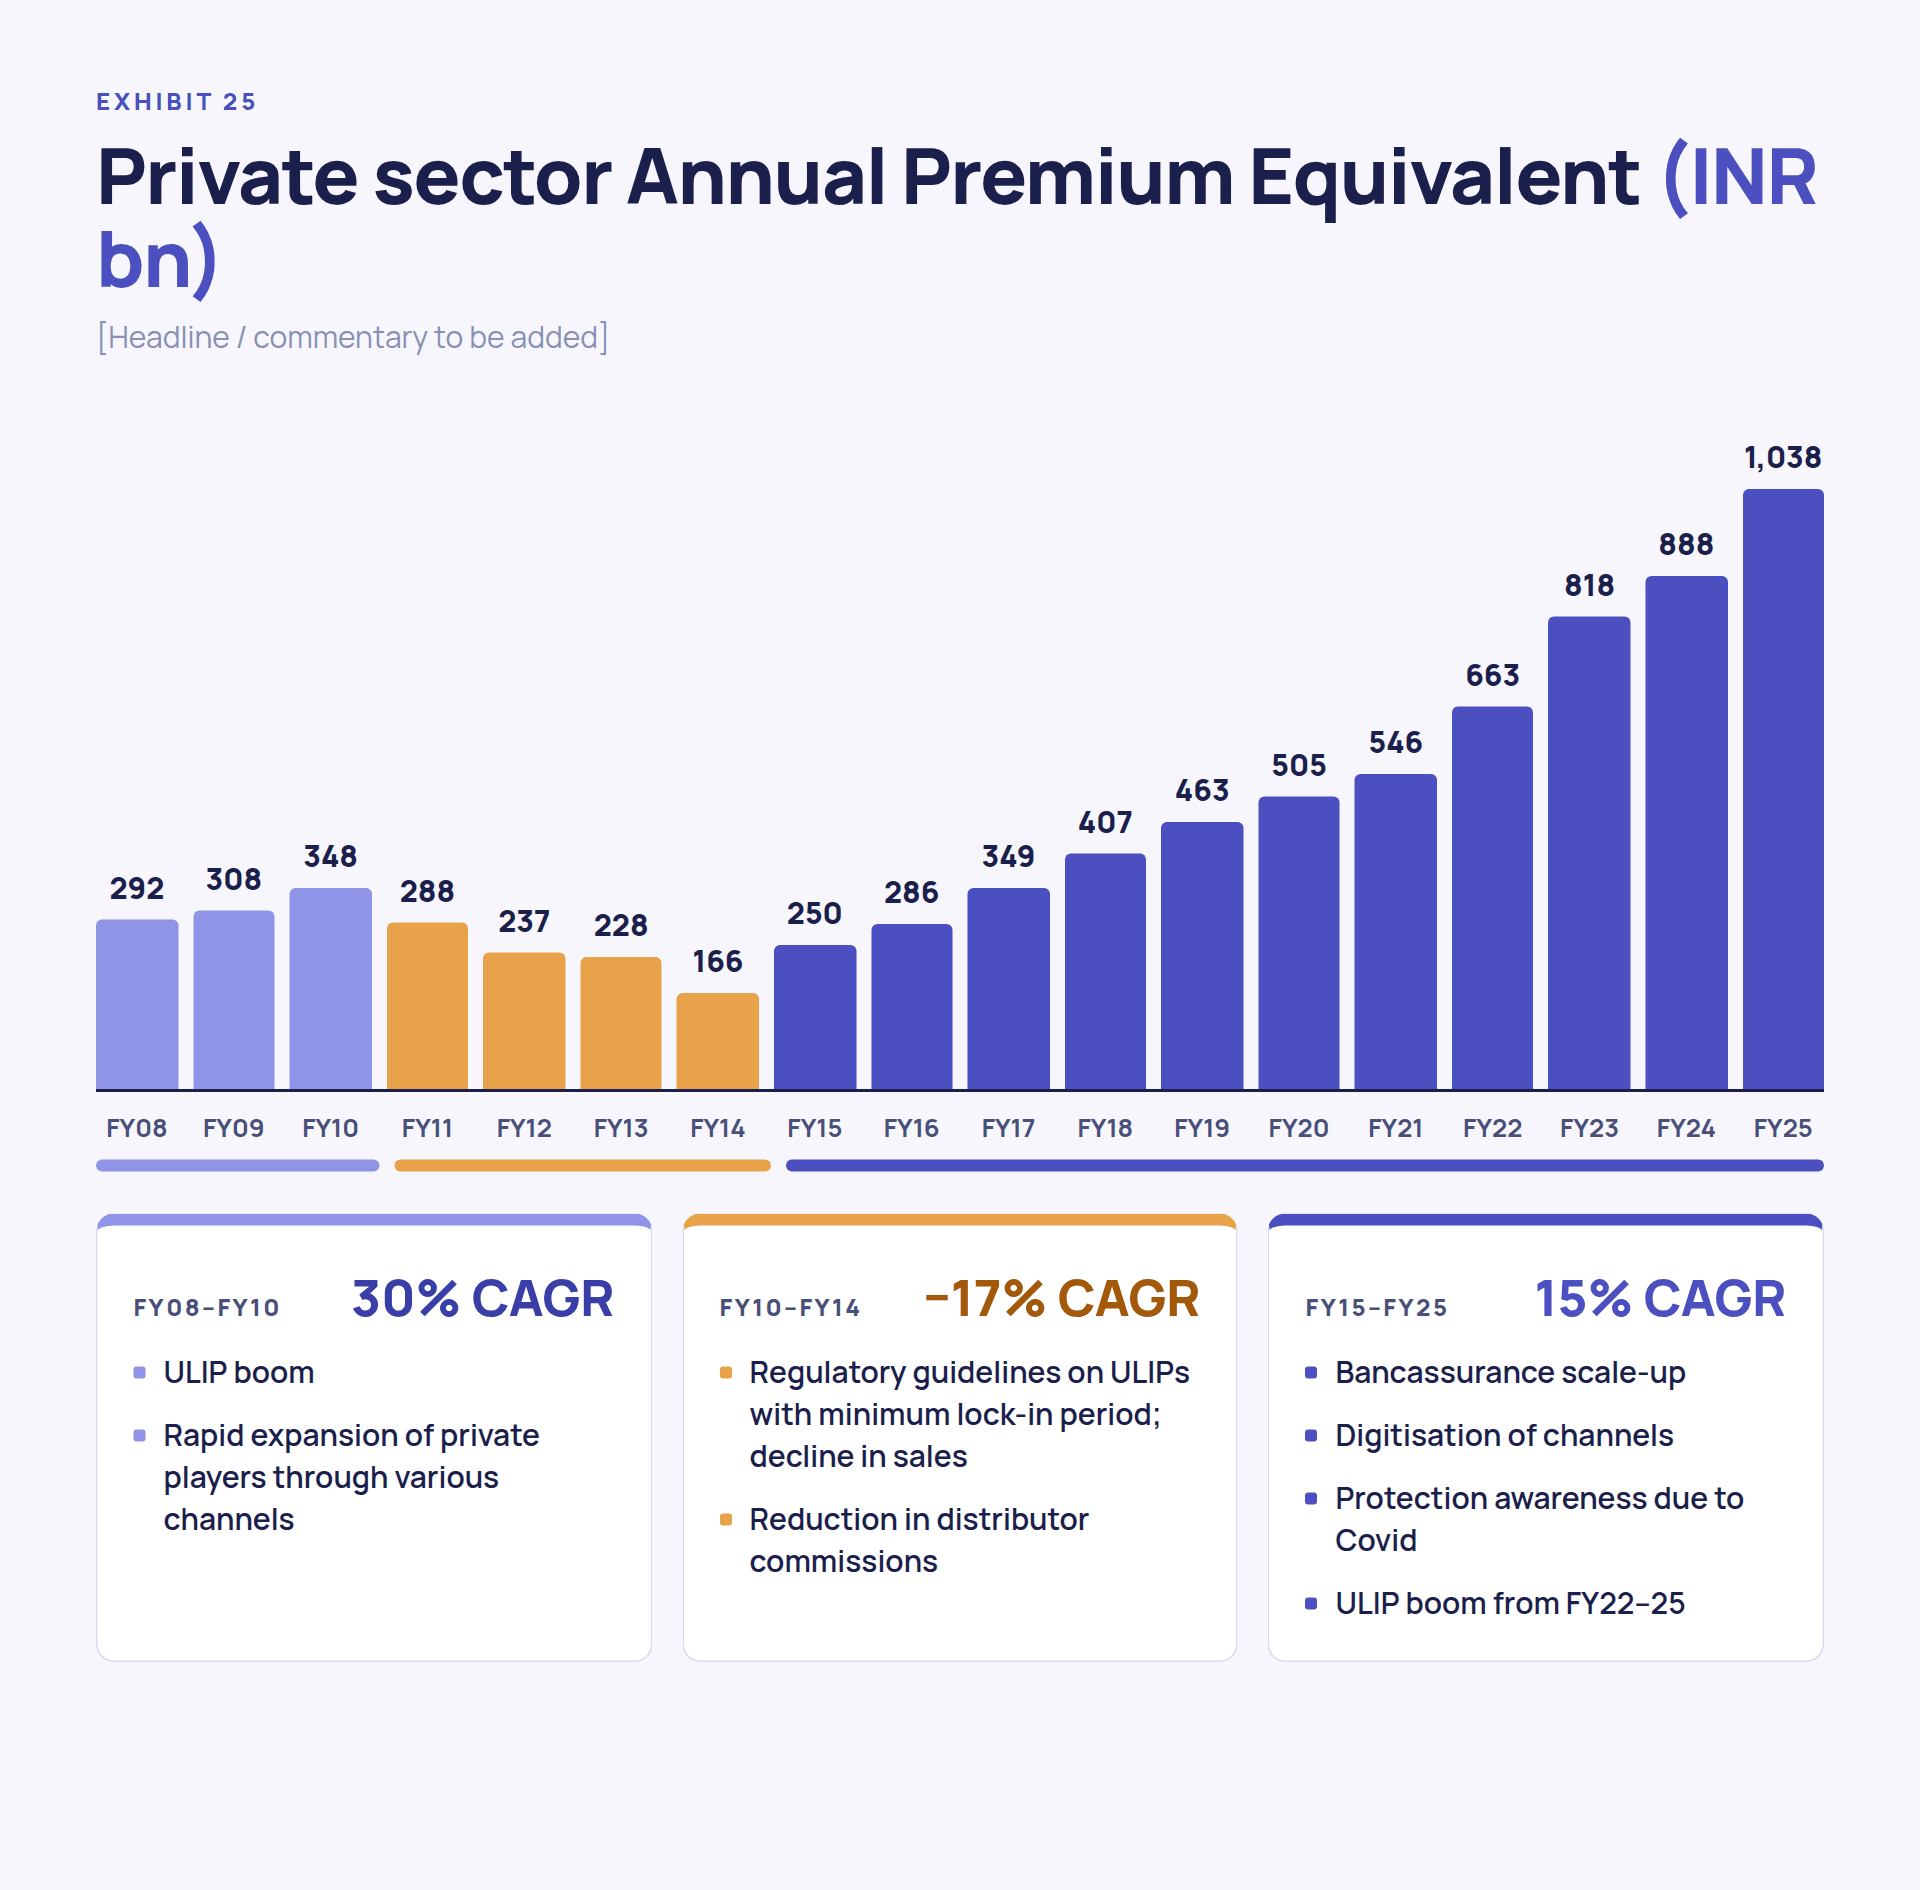
Three lessons carry over. Each is an inference, not a prediction.
Regulation reroutes volume
Money moved to channels that could still earn a return under the new terms. Analyses cited by Upstox point the same way: after India's 2009 ban on mutual-fund entry loads, assets later grew more than elevenfold, while Australia's halving of upfront life commissions was followed by a sharp fall in advisers and new policies. Substitutes decide the outcome.
Recovery is measured in years
From the FY10 peak to a new high took seven years, three of them just to regain the old level. A company priced for a quick bounce is making a different bet from the one history offers.
The payer of the cost has changed
The 2010 rules changed what the policyholder received. The 2026 draft changes what the seller receives. Premiums are unchanged, so demand may hold up better while supply, meaning how many people sell and how hard, absorbs the shock. A fall in selling effort, not in need, is the risk to watch.
06A working map: four layers, three variables
To be useful beyond the week's headlines, a map must survive whatever the final rules say. We propose four layers of the value chain and three variables that set exposure within each.
| Layer | Who | How they earn | Main pressure from the draft |
|---|---|---|---|
| 1 · Manufacturers | Life, health and general insurers | Premium less claims and expenses; commission is a cost | EoM ceilings; forced shift in product and channel mix |
| 2 · Platforms | Online marketplaces and agent-network platforms | A take rate on premium, plus renewals | Lower first-year and renewal payouts; weaker acquisition economics |
| 3 · Banks and lenders | Banks and NBFCs with insurance tie-ups | Fee income from bancassurance and credit-linked cover | Cap on loan-linked cover; no compulsory bundling |
| 4 · Agents and brokers | Individual agents and small brokers | Commission only | Lower payouts, though reported life ceilings are higher for agents (25%) than for distribution entities (20%) |
The final row hides a tilt. If the reported life ceilings survive, with agents allowed 25 per cent against 20 per cent for corporate distribution entities on long-term policies, the draft nudges business toward agency channels. That fits the market's reaction: the agency-led health insurer barely moved while the platforms fell by half.
Three variables that set exposure
- 1. Commission dependence
- What share of profit is commission? For banks, use the share of PPOP; for platforms, the take rate and the renewal share of revenue. Higher dependence means higher exposure.
- 2. Product mix
- How much of the book sits in the hard-capped products: loan-linked cover, single-premium savings (reported ceilings of 1 to 2 per cent), new health and third-party motor? Regular-premium protection is the safer end.
- 3. Owned versus rented customer
- Does the firm own a channel, such as agents or a bank parent, or rent one? Can it cut cost per policy without cutting the service that creates loyalty? Control lowers exposure.
07Five uses of the map
1. Bank fee-income heads: re-base the stress on PPOP
Take the insurance share of PPOP, apply a haircut, and read the gross hit (Table 4). Then net off realistic offsets: cost cuts, repricing, a pivot to fee-for-service advice. The logic also indicates which product to stop pushing first, which is loan-linked cover.
2. Distributor strategy teams: set acquisition limits from break-even renewals
Break-even renewals equal the acquisition cost less the first-year payout, divided by the renewal payout. In Table 2 that is (₹2,500 − ₹1,500) ÷ ₹500 = 2. Pursue only the segments whose realistic retention clears that number, and spend service money where it protects renewals, such as claims assistance.
3. Insurer product teams: plan for the expense envelope
Reports on the paper cite life expense limits of 15 per cent of gross direct premium within two years and 12.5 per cent within five, against a private-life expense ratio of roughly 20 per cent in FY26, a squeeze of 500 to 750 basis points. That points toward regular-premium protection, direct channels and agency, and away from commission-heavy savings products.
4. Investors and screeners: score names on the three variables
Rate each name low, medium or high on dependence, product mix and control, then compare the result with what the price already assumes. Table 6 applies the method to the names discussed in this report. A low price after a fall is not enough; the question is what profit is sustainable.
5. Advisers and new entrants: price service, not the sale
As the sale becomes less lucrative, the gap moves to services that raise persistency: renewal management, claims help, and advice that stays with the customer. Because life commissions are to be tied to the premium-paying term, businesses that keep policies in force are paid for doing so. That is where a new entrant has room to compete.
| Name | Dependence | Product mix | Control | Overall | Basis |
|---|---|---|---|---|---|
| PB Fintech | High | High | Medium | High | Commission is revenue; management says general-insurance revenue could fall to a third to 40% of today's level |
| Turtlemint | High | High | Medium | High | Same model; a reported FY26 loss leaves less room to absorb a take-rate cut |
| DCB, Yes, IDFC First | High | High | Medium | Medium–high | 12–16% of PPOP; fast-growing, loan-adjacent fee lines |
| HDFC Life, Max Financial | Medium | High | Medium | Medium–high | HSBC flagged both, with PB Fintech, as most exposed to the expense limits |
| HDFC Bank, Axis, Kotak | Low–medium | Medium | Medium | Medium | 5–9% of PPOP; Macquarie sees HDFC Bank and Axis more at risk than peers |
| Star Health | Low | Medium | High | Low | About 85% of business via own agents (Jefferies); closed flat on 24 Sep |
08Scenarios and what to watch
The draft will not stay as it is. The useful question is which version the market is pricing, and which signals would show it moving.
| Scenario | What it would mean | Early signals |
|---|---|---|
| Softened: higher ceilings, longer glide path, existing renewals protected | A smaller take-rate cut; distributors' earnings fall less; relief for insurers' expense plans | Statements after the comment window closes; a revised draft; brokers arguing that the caps need revisiting, as Systematix has |
| As drafted | A take-rate reset; consolidation among distributors; insurers lean on agency and direct; bank fee lines shrink at the margin | Further broker estimate cuts; management commentary on hiring and cost; mix shifts in insurers' reported numbers |
| Harsher, or reaching existing renewals | The renewal annuity is impaired; a larger earnings cut than the 30–46% stress range; business-model change for platforms | Final wording on renewals and on how past policies are treated, which Value Research flags as the main swing factor |
| Date | Event | Why it matters |
|---|---|---|
| 25 Oct | Comment window on the consultation paper closes | Last chance for industry to move the draft |
| 27 Oct | Max Financial board meets on Q2 results | First read on how a life-insurance holding company discusses the expense limits |
| 29 Oct | PB Fintech results, as listed by data vendors (confirm with the company) | First management read on take rate and cost response |
Piramal Finance has said it expects to keep its FY27 profit-growth target and puts the draft's effect on FY28 return on assets at 18 to 24 basis points. Statements of this kind, from lenders that hold an insurer stake, are the cleanest early test of how much of the shock is gross and how much survives after offsets.
09Bottom line
Read the week as a sorting event. The draft separates firms that rent a customer from firms that own one, products people choose from products people are steered into, and revenue that repeats from revenue that is bought. Exposure follows those lines more reliably than it follows sector labels. If the rules land near the draft, the winners will be those with owned channels and low-cost service, and the losers those whose margin depended on a captive moment of sale. If the rules soften, the map still shows which businesses were most exposed and what to ask of them next.
·Sources, method and terms
- Ideas and figures on PB Fintech's customer economics, hiring, earnings stress tests and valuation arithmetic come from Value Research, PB Fintech: How much is each customer still worth? (1 October 2026), restated here in our own words.
- Bank data: JM Financial (Figure 2) and Moneycontrol Research (Figure 3). Industry premium data: the sector chart in Figure 4. Historical analogues: Upstox Originals.
- Share prices: NSE and BSE prices as reported by market-data sites to 1 October 2026. Broker views: Jefferies, HSBC, Macquarie and Systematix, as reported in the business press.
- The IRDAI figures come from press summaries of the consultation paper, not from the paper itself, and should be checked against it.
- Our own work: the worked example, the 30 per cent stress, the scorecard and the readings labelled as inference. They are illustrations and judgements, not forecasts or ratings.
- PBT / PPOP
- Profit before tax / pre-provision operating profit, the profit before loan-loss provisions.
- EoM
- Expenses of management: the overall limit on what an insurer may spend on acquiring and servicing business.
- APE
- Annual premium equivalent: new regular premiums plus a tenth of single premiums, a standard measure of life-insurance sales.
- Take rate
- The share of premium a distributor keeps as commission.
- Persistency
- The share of policies that remain in force from one year to the next.
- ULIP
- Unit-linked insurance plan, which combines insurance cover with market-linked investment.